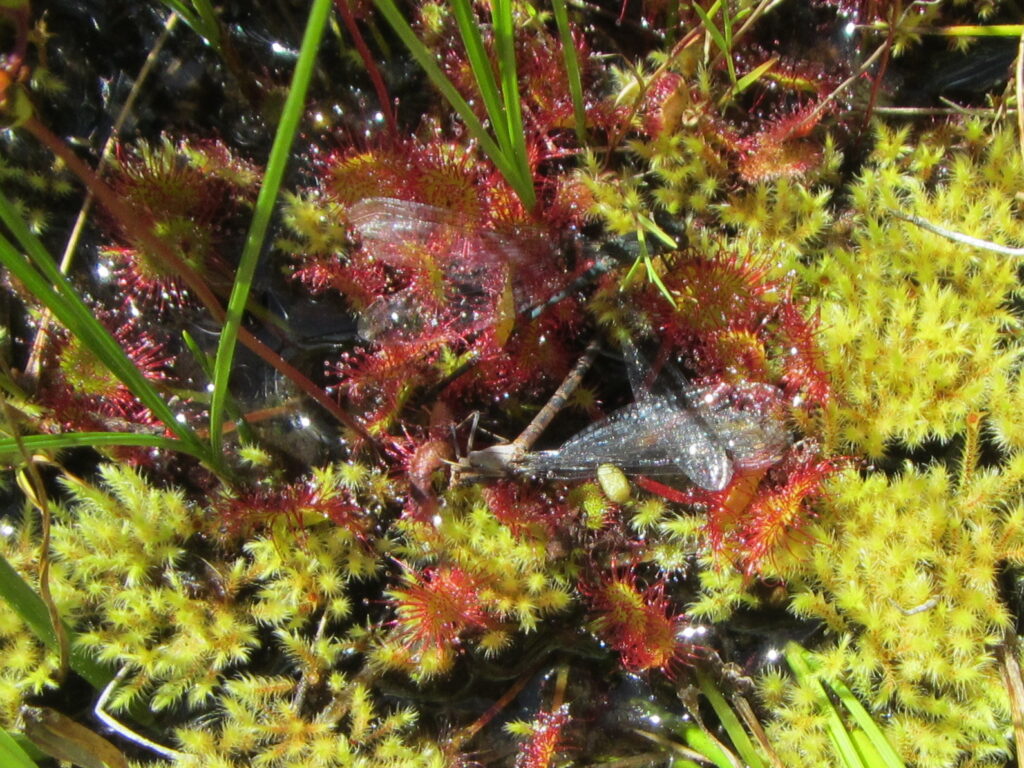
In honor of Darwin’s Birthday here’s a picture of a few damselflies caught by roundleaf sundew in a Sierra Nevada wetland. Darwin studied roundleaf sundew’s carnivorous adaptations to life in harsh environments and published his findings in “Insectivorous Plants” in 1875. https://archive.org/details/insectivorousplant00darw
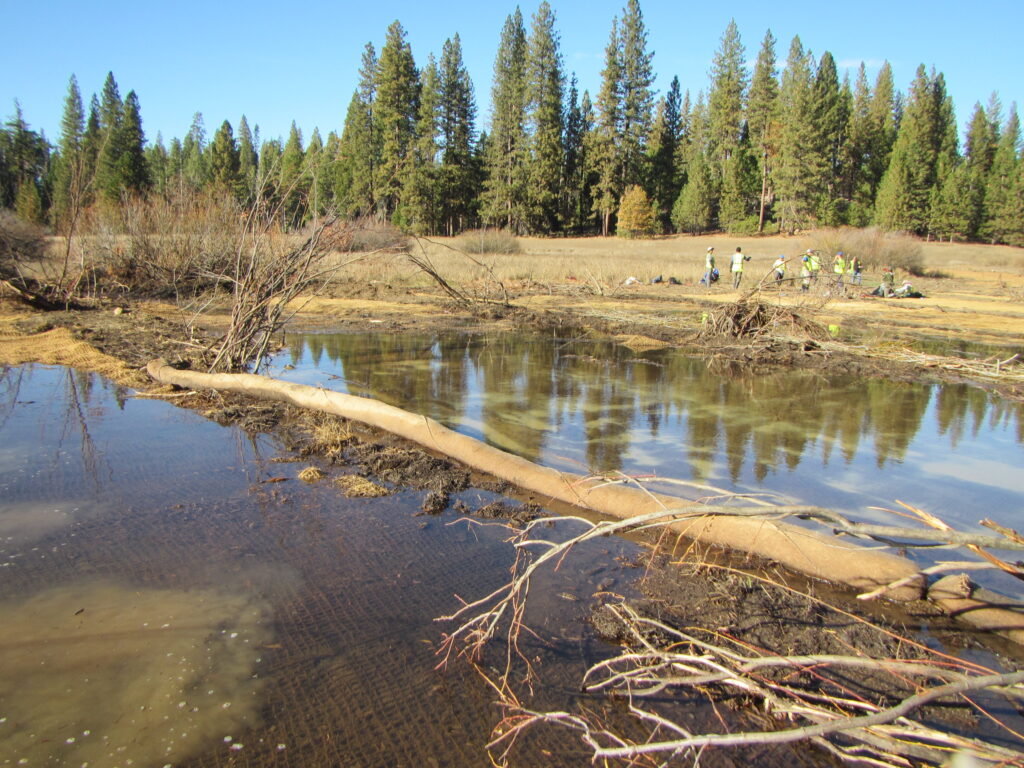
For World Wetlands Day here’s a picture of water flowing out onto the surface of Ackerson Meadow, Yosemite National Park for the first time in >100 years. It’s an honor and privilege to be a part of the team restoring this wetland by filling in an enormous erosion gully. https://www.nps.gov/yose/getinvolved/ackersonmeadow.htm
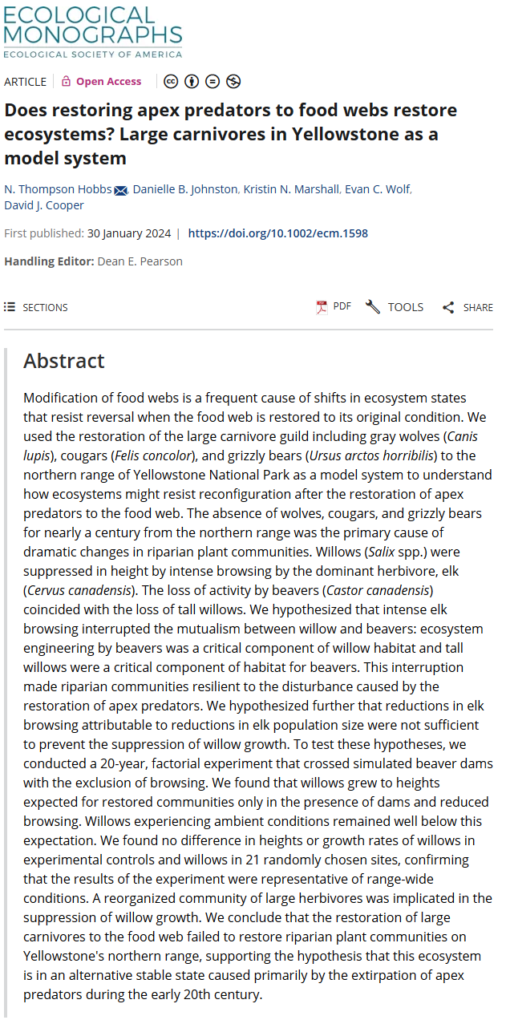
I started my professional ecological research with my Masters project in Yellowstone National Park more than two decades ago. During that project I helped establish the long-term research plots and data collection methods that led to this just-published summary of what happens when willows are protected from browsing and have extra water provided by simulated beaver dams.
As we hypothesized, the small streams in Yellowstone that used to support resident beaver for centuries, but lost them in the 1920s-1930s, have not seen a rapid recovery of willow just because wolves were reintroduced in the 1990s. Nor have the beavers returned in significant numbers. The impacted ecosystem, where streams eroded through the long-abandoned beaver dams and dried out conditions for willows, needs more than just reduced browsing pressure to recover.
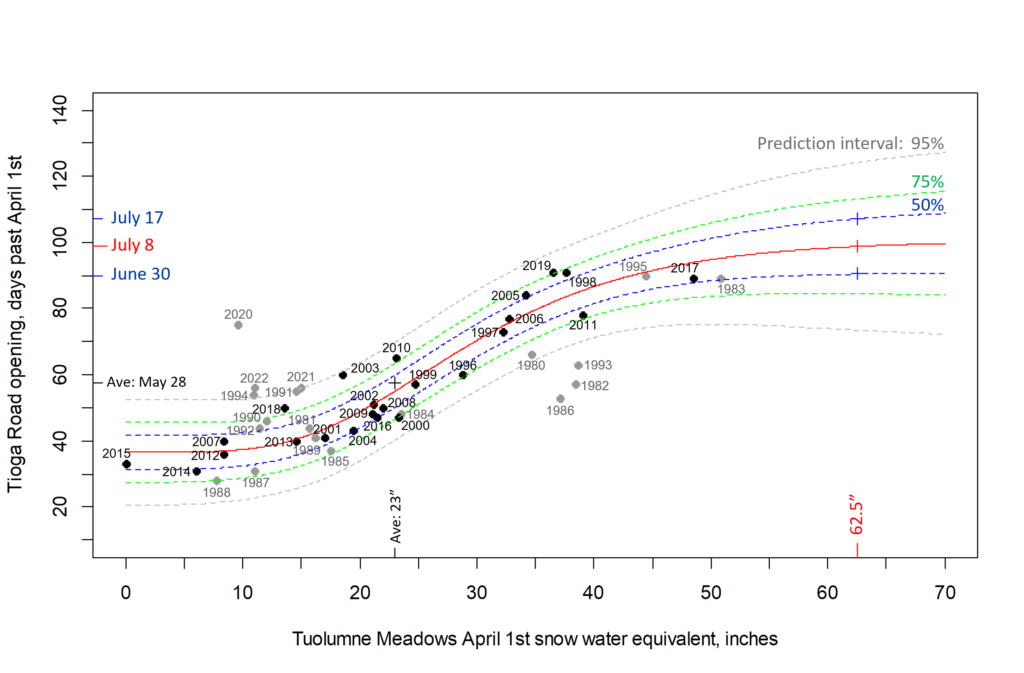
It’s that time of year again to guess when the Tioga Road will open!
The 2023 Tioga Road opening date prediction is July 8th,
with a 50% chance that the real opening date will fall between June 30th and July 17th.
This is based off of the WHOPPING 62.5″ of snow water equivalent measured at the Tuolumne Meadows snow course for the April 1 report.
This huge winter has presented many challenges, this prediction included. For the first time since I started this in 2018 I need to extrapolate, to make a prediction outside of the range of existing data. I’ve ditched the linear model, since it doesn’t make sense that added inches of Apr 1 snow will have the same effect on road openings from May to July. As a snowpack lingers into June, those extra inches will melt away much faster than they did in April and May. So, I switched to a Gompertz function that has a lower and upper asymptote, which seems like a much better model for how snowpack affects getting a road open.
Data excluded from the model are the grey dots and dates on graph: 1995 and earlier, due to significantly different wilderness and safety regulations; 2020-2022 due to covid impacts to Park staffing and operations.
I’ll post the R code to Github if anyone wants it.